The data below can be sorted to show specific counties, municipalities, and time periods. The charts show, by the month and year, the total number of people assisted each month, and the meals equivalent of food provided. To protect the privacy of our guests, we limit the questions asked to a person’s city/town of residence, the number of people in their household, and the general age ranges of members of their household.
The Food Bank’s fiscal year 2024 data is also available in PDF format for each county and all of Western Massachusetts:
Beyond the Numbers
Telling the Full Story
The amount of food we provide and the number of people we impact are the easiest measurable Food Bank metrics, but our impact reaches much further. From our SNAP enrollment assistance and our advocacy work to our less quantifiable impact on the day-to-day life of people living with food insecurity and hunger, the story of The Food Bank is more complex than numbers alone can tell.

Annual Reports
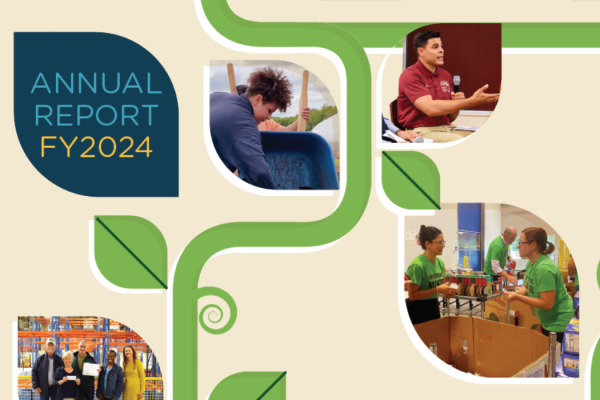
Our Annual Reports, past and present, show a yearly snapshot of the work of the Food Bank and feature highlights of the year’s achievements alongside acknowledgements of donors, insights from staff, and important annual data.

Word of Mouth
Released quarterly in print to donors and online to the public, the Word of Mouth newsletter gives deeper insights into the work of the Food Bank, with articles featuring partner food pantries, nutrition recipes, interviews with board members, and more!

News & Press
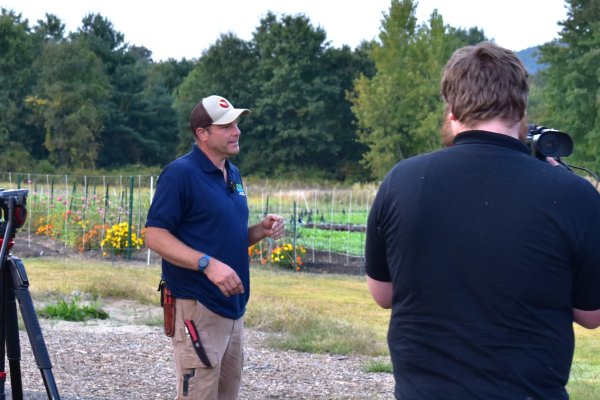
Local news organizations regularly feature the Food Bank or one of our many incredible community partners. Our newsroom offers easy access to to these stories, as well as our press kit for news and media sources.

